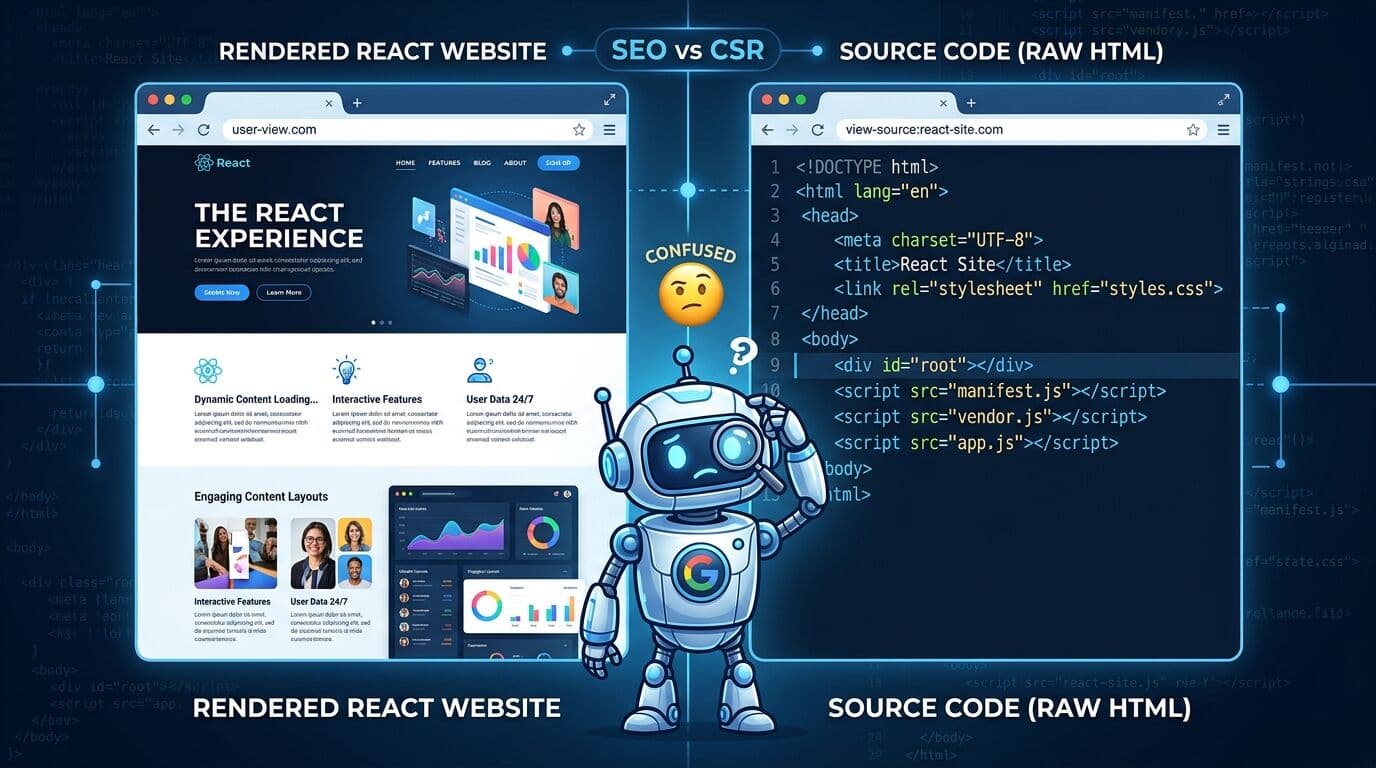
Every second your website hesitates, potential customers disappear. Small businesses lose an average of 40% of their conversions when page load times exceed 3 seconds — a problem most don’t even realize they have. Building a custom React performance analytics system gives you real-time visibility into these costly speed issues before they drain your revenue.
This isn’t about generic monitoring tools that cost $200+ monthly. You need targeted React dashboard analytics that catch the specific performance bottlenecks killing small business conversions.
Why Generic Analytics Miss Critical Performance Issues
Most small businesses rely on Google Analytics or basic uptime monitors. These tools show you traffic patterns but miss the performance killers that matter.
Real conversion damage happens in the gray areas. Your site might be “up” but loading so slowly that visitors bounce before tracking pixels even fire. I’ve seen e-commerce sites lose $3,000 monthly because their product pages took 8 seconds to become interactive — but their monitoring showed everything as “green.”
React performance analytics systems catch these problems by monitoring actual user experience metrics, not just server response times.
Core Metrics That Predict Conversion Loss
Focus on these four performance indicators that directly correlate with conversion rates:
First Contentful Paint (FCP) — When users first see something meaningful. Target: under 1.8 seconds.
Largest Contentful Paint (LCP) — When the main content finishes loading. Target: under 2.5 seconds.
Cumulative Layout Shift (CLS) — How much your page jumps around while loading. Target: under 0.1.
First Input Delay (FID) — Time between user interaction and browser response. Target: under 100ms.
These aren’t arbitrary numbers. Google’s research shows that improving LCP from 4 seconds to 2 seconds increases conversion rates by 23% on average.
Building Your React Performance Analytics Dashboard
Start with the Web Vitals library and React’s built-in performance hooks. Here’s the foundation:
Your analytics system needs three components: data collection, real-time processing, and intelligent alerting. The collection layer uses the Performance Observer API to grab user experience metrics as they happen.
Set up automatic performance tracking that captures every page load, user interaction, and resource timing. Most businesses only monitor their homepage — but checkout pages and product detail pages often perform worse and cost more conversions.
Data Collection Strategy
Monitor performance across device types and connection speeds. Mobile users on 3G connections behave differently than desktop users on fiber.
Track performance by traffic source too. Users from Facebook ads might experience different loading patterns than organic search visitors. This granularity helps you identify where conversion losses concentrate.
Store this data in a format that supports fast queries. Time-series databases work well, but even a properly indexed PostgreSQL setup handles most small business volumes.
Real-Time Alert System
Configure alerts that fire when performance drops below conversion-critical thresholds. Don’t just alert on averages — watch for spikes in slow experiences.
If 20% of your users suddenly experience LCP times over 4 seconds, you need to know immediately. That’s the difference between catching a problem in 10 minutes versus discovering it next month in your revenue reports.
Implementation Patterns That Actually Work
Most performance monitoring fails because it’s too complex or too simple. The sweet spot? Focus on actionable insights over comprehensive data.
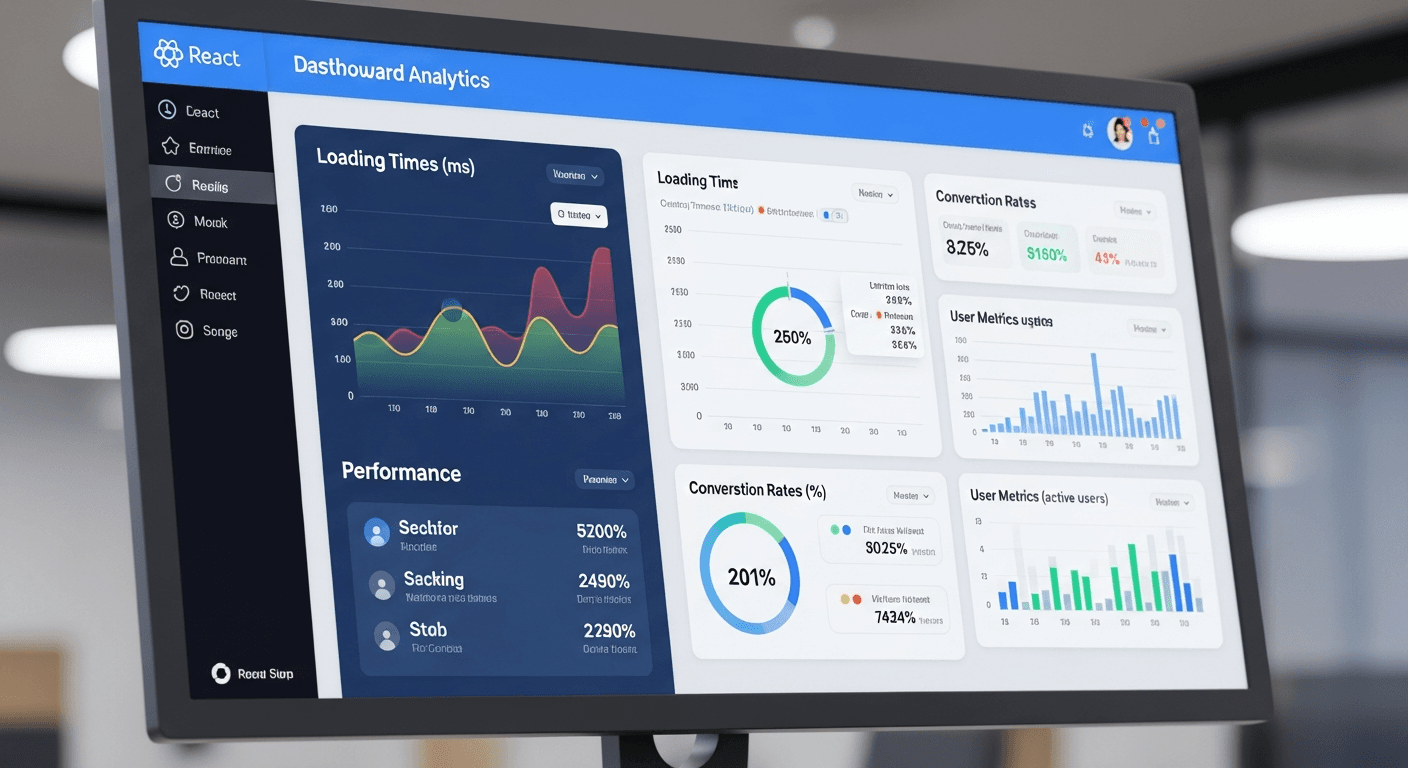
Build your React dashboard to surface the “why” behind performance problems. When LCP spikes, show which specific resources caused the delay. When CLS jumps, highlight the exact DOM elements shifting around.
I recommend starting with a single-page dashboard that answers three questions: What’s slow right now? Why is it slow? What’s the business impact?
Resource Timing Integration
Connect performance metrics to actual business outcomes. Track correlation between page speed and conversion rates, average order values, and customer lifetime value.
This transforms performance monitoring from a technical exercise into revenue protection. When you can show that fixing a 2-second delay will recover $1,200 monthly in lost sales, performance optimization becomes a business priority.
Website Speed Optimization Based on Real Data
Your React performance analytics system should guide optimization decisions, not just report problems.
Prioritize fixes by revenue impact. A 500ms improvement on your checkout page matters more than a 2-second improvement on your about page. Your analytics dashboard should make these trade-offs obvious.
Focus on the performance issues affecting the most users first. If 60% of your mobile visitors experience slow LCP but only 10% see high CLS, tackle LCP optimization first.
Automated Performance Budgets
Set performance budgets that prevent regression. If your homepage LCP averages 2.1 seconds, alert when it crosses 2.5 seconds for more than 10% of users.
This proactive approach prevents the gradual performance decay that kills conversions over time. Most businesses don’t notice when their site gets 10% slower each month — but their customers do.
Small Business Conversion Tracking Integration
Connect your performance data directly to conversion events. Track how load times affect form submissions, purchases, phone calls, and email signups.
This creates a feedback loop between performance and business results. You’ll spot patterns like “users who experience sub-2-second load times convert 67% more often” or “mobile checkout abandonment jumps 3x when FID exceeds 200ms.”
Most small businesses discover surprising performance-conversion relationships. Local service businesses often find that slow-loading contact forms cost more leads than they realize. E-commerce sites frequently underestimate how page speed affects repeat purchases.
Conclusion
Building a React-based performance analytics system transforms website speed from a technical concern into a revenue driver. Instead of wondering why conversions dropped last month, you’ll catch and fix performance problems before they impact your bottom line.
Start simple: collect the four core metrics, build alerts for conversion-critical thresholds, and connect performance data to actual business outcomes. Your custom solution will outperform expensive monitoring services because it focuses specifically on the metrics that matter for your conversion rates.
The 40% conversion loss from slow websites isn’t inevitable — it’s preventable with the right visibility and rapid response to performance issues.
Frequently Asked Questions
What’s the difference between React performance analytics and traditional website monitoring?
React performance analytics focuses on user experience metrics like First Contentful Paint and Largest Contentful Paint, while traditional monitoring mainly tracks server uptime and response times. Traditional tools miss the performance issues that actually affect conversions — like slow JavaScript execution or layout shifts that frustrate users.
How much does it cost to build a custom React performance analytics system?
Development costs typically range from $5,000-$15,000 depending on complexity, but ongoing hosting costs stay under $50 monthly for most small businesses. This compares favorably to enterprise monitoring solutions that charge $200-$500 monthly and don’t provide conversion-focused insights.
Which performance metrics have the biggest impact on small business conversions?
Largest Contentful Paint (LCP) shows the strongest correlation with conversion rates. Research indicates that improving LCP from 4 seconds to 2 seconds increases conversions by approximately 23%. First Input Delay also significantly affects form submissions and checkout completion rates.
Can I use Google Analytics for performance monitoring instead?
Google Analytics provides basic page timing data but lacks the real-time alerting and detailed breakdown needed for actionable performance optimization. It won’t tell you that your checkout page’s 4-second load time is costing you $800 monthly in lost sales, or alert you when performance suddenly degrades.
How quickly should I expect to see ROI from performance improvements?
Most small businesses see conversion rate improvements within 2-4 weeks of implementing performance fixes identified by their analytics system. The key is focusing on high-traffic, high-value pages first — homepage, product pages, and checkout flows typically provide the fastest payback.
Do I need technical expertise to maintain a React performance analytics system?
Basic maintenance requires moderate technical skills — updating monitoring code, adjusting alert thresholds, and interpreting dashboard data. However, the initial setup and advanced customization benefit from React development experience or working with a developer familiar with performance monitoring APIs.